
In 2006, we read an article from Eric Bazin et al., who argued that using mtDNA variation to indicate population size, is a flawed methodology. The work from his team was seemingly exhaustive, it involved sampling a collection of polymorphism data sets covering around 3,000 species to tackle one of the most basic postulates in population genetics: that species with large population sizes should have more genetic diversity than species with small population sizes. In a nutshell, Bazin et al. said that mtDNA wasn’t a diverse enough loci to calculate population size. The research spurred a set of questions about whether or not mtDNA is in fact a reliable predictor of human population size, the most notable criticism came from Adam Eyre-Walker who wrote to Science in the same issue.
Since then, the statistical approaches to estimate population genetic parameters have been improved. One of them, as Simon Greenhill summarizes, is the Bayesian Skyline Plots,
“which takes a Bayesian approach to coalescent theory to infer the effective population sizes by simultaneously estimating and accounting for the ancestral genealogy, branch lengths, substitution model of DNA evolution, and population parameters.”
Couple that with a lot more complete mtDNA genomes of people from around the world, and you have a more credible, accurate, and robust way to calculate effective population size from mtDNA diversity that incorporates uncertainty from detailed variables such as underlying ancestral gene tree, branch lengths, and rate parameters that Simon mentioned.
Quentin D. Atkinson, Russell D. Gray and Alexei J. Drummond took advantage of these improvements and investigated human population sizes through time across eight major geographic regions. They just published their results in the journal Molecular Biology and Evolution. In the paper, “mtDNA Variation Predicts Population Size in Humans and Reveals a Major Southern Asian Chapter in Human Prehistory,”Atkinson et al., describe how they went about doing their study. They tried to gather up 25-50 mtDNA sequences from each of the geographical locations, and ended up with a sample size of 357 human mtDNA sequences.
They aligned their sequences using ClustalX, and the algorithms were applied to make sense of the diversity observed. The authors write that they calibrated rates of molecular evolution in order to plot changes in population size over time by using the 45,000 year old age of the presence of the haplotype Q in New Guinea — which is a very frequent haplotype. Ultimately the molecular clock they used had this rate: .000000017 substitutions per site per year.
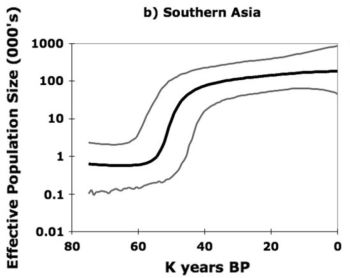 From this, the following estimations could be made about early human populations. From about 200,000 years ago to 140,000 years ago, human populations were relatively slow to grow in sub-Saharan Africa. But by 70,000 years ago, a rapid population expansion occurred into Eurasia. At 52,000 years ago, Southern Asia experienced an even more massive population burst that’s remarkable compared to the other groups sampled. The graph the authors provide to plot Southern Asia’s population growth since the last 70,000 years is to your right.
Simon has a much more thorough summary of what happened elsewhere throughout the world, but I particularly appreciate the estimated 18,000 years old population boom in the Americas that correlates with the conclusions drawn about by this 2007 mtDNA study on rate of the peopling of the Americas. I covered that article last October, if you’re interested.
This massive expansion of Southern Asia’s population is an interesting one, especially because Ken Alpin recently came up with a similar conclusion using rat genetics. Since rats follow human populations, and they are closely associated with really dense human populations, they offer a unique way to trace human migrations and population sizes. The modern day rat populations originate from a South Asian rat population that boomed about 50,000 years ago right about the same time humans in South Asia were experiencing a population expansion.
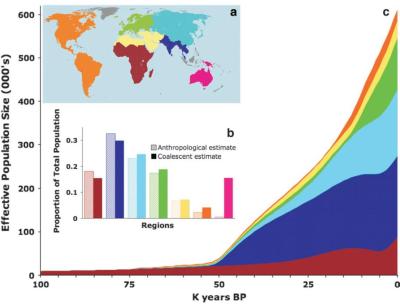
I’ll wrap up this post with a really awesome graph the authors provide in their paper documenting relative regional population sizes through time. Its amazing to see the logistic growth curve, especially because most growth curves I’ve seen only go back to 12,000 years ago and trace populations in the billions. In this study, I’m amazing how Atkinson and crew were able to resolve much finer population sizes.
One last thing, do check out one of the co-authors blogs, Alexei Drummon’s Computational Biology and Evolution. He’s posted about this paper almost a month and half ago.
- Atkinson, Q.D., Gray, R.D., Drummond, A.J. (2008). mtDNA Variation Predicts Population Size in Humans and Reveals a Major Southern Asian Chapter in Human Prehistory. Molecular Biology and Evolution, 25(2), 468-474. DOI: 10.1093/molbev/msm277

nice. there’s prefiguration of this model in s. oppenheimer’s book ‘the real eve.’
Hi,
If the population experiences a drop for various reasons, would that be reflected in these graphs / methods?
Lets take the example of today: If south asia’s current population of 1 Billion people were to experience a drop to 50,000 due to war…and someone were to look at this data of us 1,000 years in the future, would they be able to determine that the population was 1 Billion at our time, but subsequently dropped and than started growing over time again?
The population of the Americas is more than 500M, however, the .JPEG graph doesn’t indicate this. The .JPEG graph severely underestimates the population of the Americas.
Boston_mahesh, I think you’re clearly missing the point of this figure. I’m confident in assuming that, we, including the authors of this peer reviewed paper, all know the current population of the Americas is greater than 500,000,0000. Come on now…
If they were gonna be documenting population growth up ’til 20008 it would be a ridiculously exponential growth curve that would have be marked on a logarithmic scale on the y-axis. Furthermore, human populations, especially those in the Americas, didn’t exponentially grow until relatively recently, i.e. the last 200 or so years. The authors made it their goal to show the relative regional population size estimates to gain a perspective on the mode and rate of human colonization of the globe during the last 100,000 years. If you look at the units on the x-axis, they didn’t break it down to the hundreds of years… rather they were resolving changes in populations over much large spans of time, in this case 5,000 year intervals!
So, in the future, please consider first thoroughly analyzing figures before you make snarky comments about a figure severely underestimating something they wasn’t even in the scope of the original research.
Kambiz
Krishna, to answer your question, yes the research did reflect drops in populations. The most notable figure the authors provide is about a 2 fold decline in European populations that ended by 15,000 years ago. This is an awesome level of detail that the authors could extract from the data because at around 15,000 years ago, the global climate was becoming cooler and dryer. The the most recent ice age ended about 10,000 years ago and during this time span food animal populations seem to have declined which reciprocally correlated with human populations.
Kambiz
Why is it we don’t see these population dips in the graph?
I don’t see any declines in population and only a flat period (no growth) that occurred roughly 5000 years ago in South Asia.
The population growth seems to coincide with the beginning of megafauna extinction. Perhaps the growth is associated with improved hunting techniques? The expansion also coincides with the apparent dating of human Y-chromosome diversification outside Africa. Perhaps all these factors are related.
Does anyone have information on megafauna extinction in India?